Why meetings are the metric that precedes pipeline
In most outbound sales motions, a booked meeting is the clearest leading indicator of future pipeline — it means a prospect engaged enough to commit calendar time. Apollo's Meeting Insights dashboard tracks this specific metric with the same rigor other tools reserve for closed revenue, treating meeting volume and quality as a first-class reporting category rather than a footnote inside a CRM.
Reading the meeting volume chart
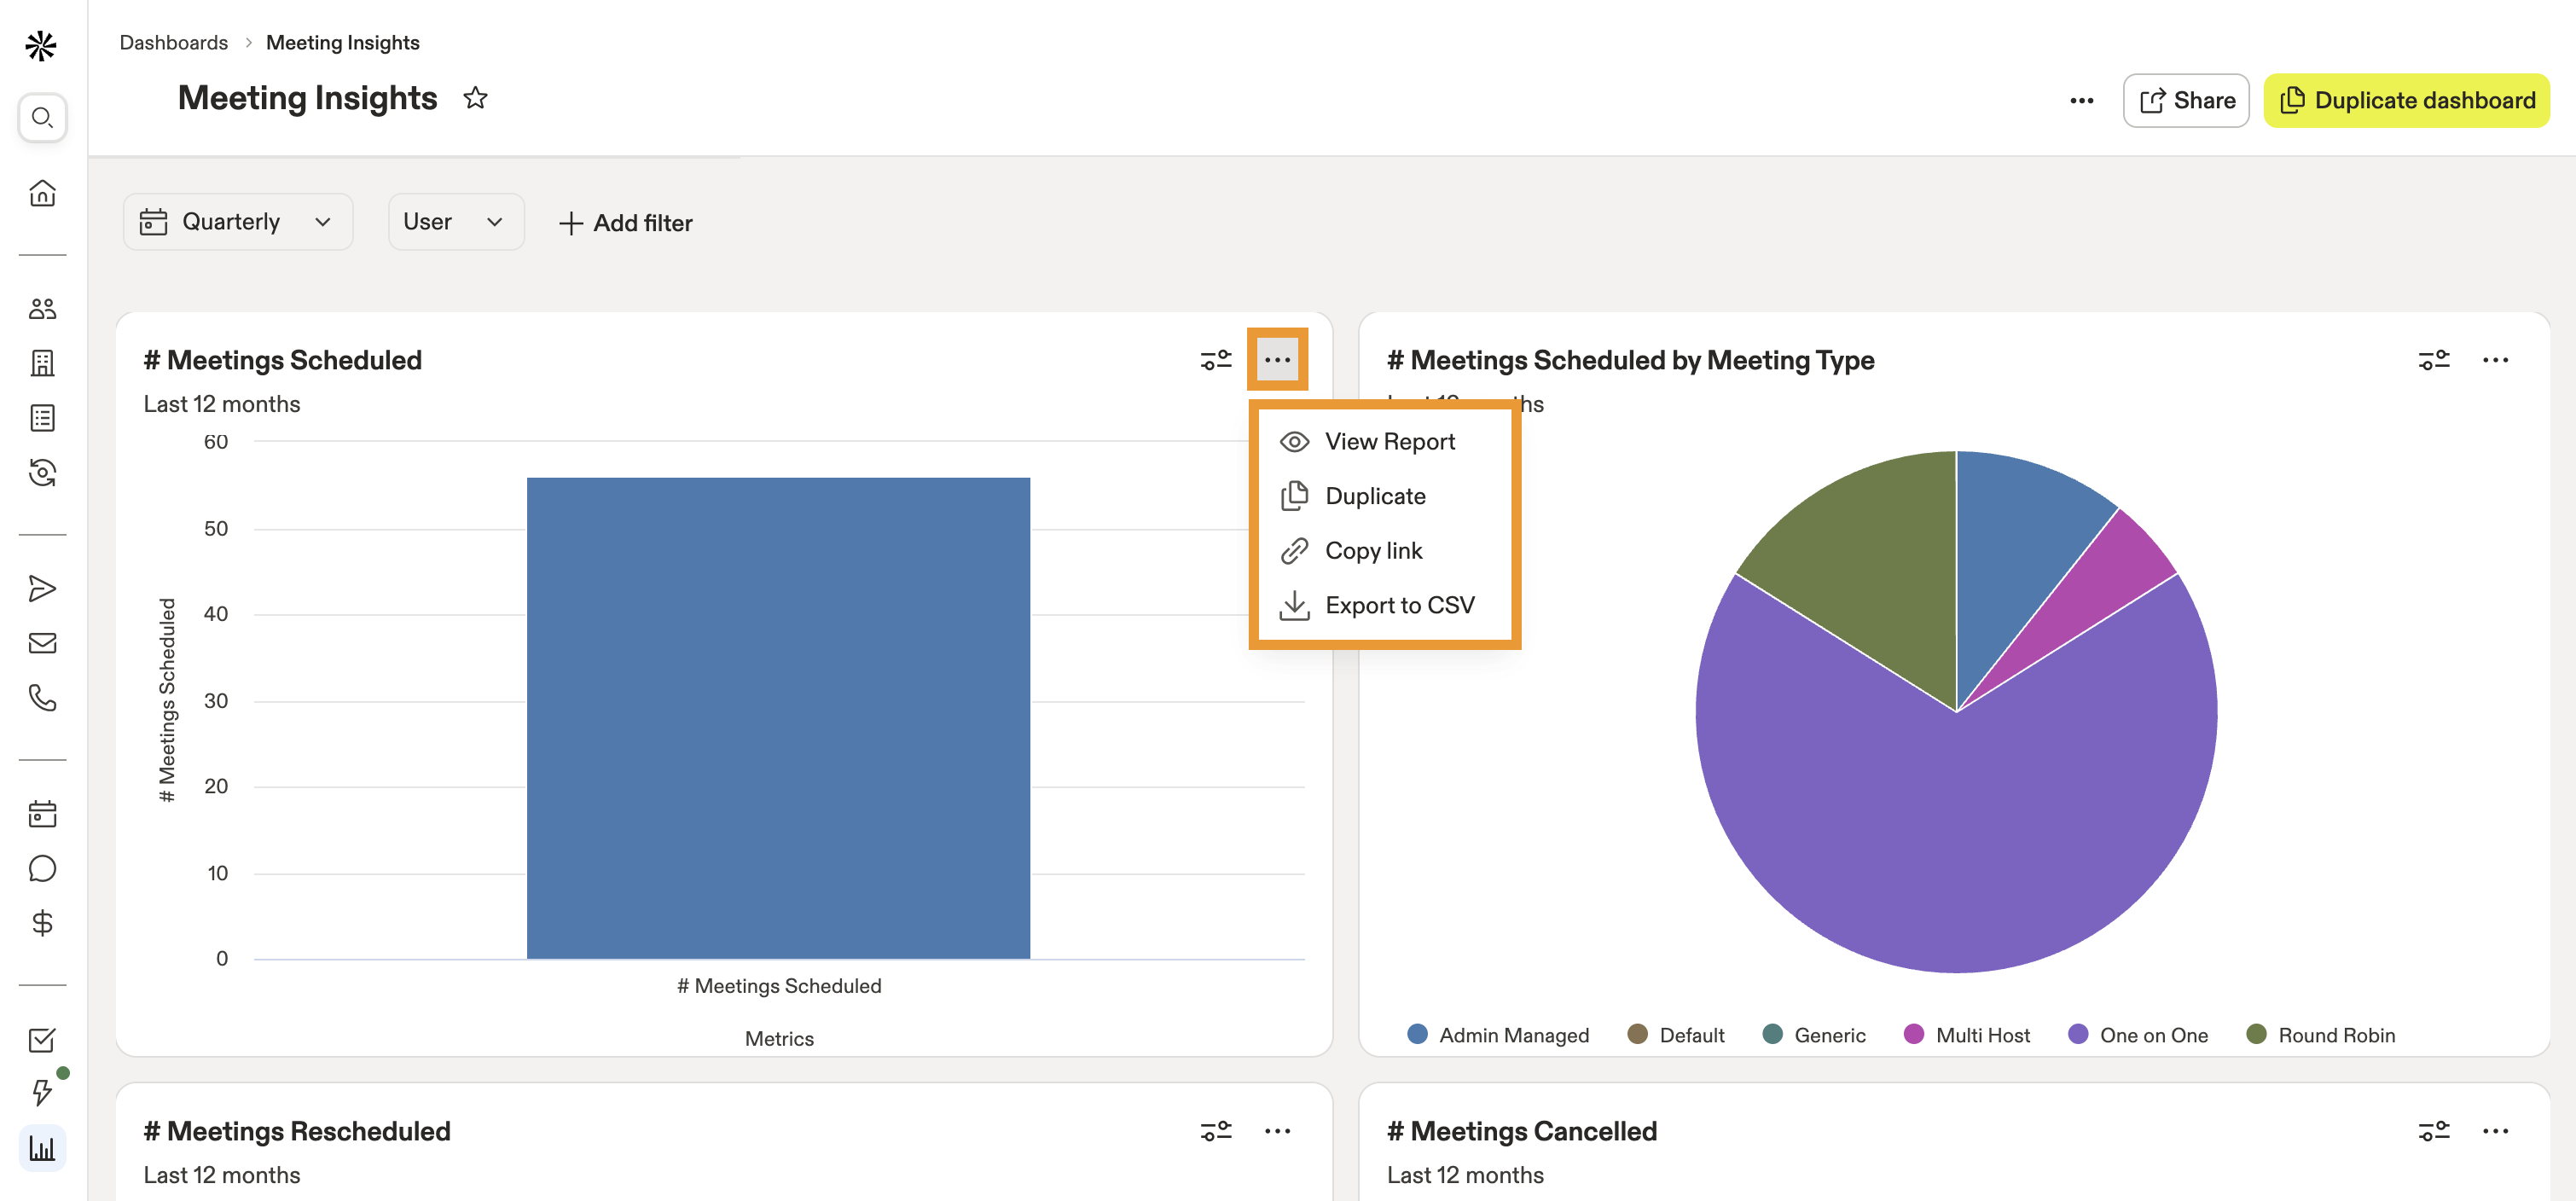
The dashboard's headline chart, '# Meetings Scheduled,' shows a bar chart over a Last 12 months window, filterable by Quarterly and by User. In the reviewed screenshot, the quarterly total sits just above 55 meetings scheduled, rendered as a single tall bar with grid lines at increments of 10 up to 60 — a simple, unambiguous view of aggregate volume before drilling into type or rep-level detail.
The filter row above the chart — Quarterly and User dropdowns plus an 'Add filter' button — signals that this dashboard, like Apollo's other reports, is designed to be sliced by time period and by individual contributor without requiring a rebuild of the underlying report.
Meeting type breakdown: where the real signal is
The companion pie chart, '# Meetings Scheduled by Meeting Type,' segments the same volume into six categories: Admin Managed, Default, Generic, Multi Host, One on One, and Round Robin. In the reviewed data, One on One meetings make up the largest single slice, followed by a smaller but meaningful share of Admin Managed and Generic types.
This breakdown matters operationally: a sales team expecting most meetings to be rep-led One on Ones but seeing a disproportionate share land in Round Robin or Admin Managed pools may have a routing configuration issue — meetings intended for a specific rep's calendar are instead being distributed through a shared scheduling pool.
If One on One meetings aren't the majority slice of the pie, it's worth checking whether your booking links are routing correctly.
Sharing and exporting the report
Each chart card in the Meeting Insights dashboard includes a contextual menu (the '...' icon) offering View Report, Duplicate, Copy link, and Export to CSV. This is a small but important detail for sales operations teams that need to circulate this data outside of Apollo — for example, exporting scheduled-meeting counts into a board deck or a quarterly business review, or duplicating a chart to build a filtered version for a specific segment without disturbing the original.
The 'Copy link' option also supports lightweight internal sharing: a sales manager can send a direct link to a specific chart in a Slack message or email rather than describing where to find it inside the dashboard library.
Two additional metrics worth tracking alongside volume
The dashboard also includes '# Meetings Rescheduled' and '# Meetings Cancelled' cards (visible below the primary charts, each covering the same last-12-months window). Tracking these alongside scheduled volume gives a more complete picture of meeting quality — a team that books many meetings but sees a high cancellation rate may have a lead-qualification problem further upstream, which ties back to the enrichment and email engagement dashboards covered elsewhere in this series.
Verdict
Apollo's Meeting Insights dashboard treats booked meetings as the leading indicator they actually are, with enough granularity — meeting type breakdown, rescheduled and cancelled tracking, quarterly and per-user filtering — to diagnose both volume and quality issues in the same view.
For revenue teams that already track pipeline and closed revenue closely but under-monitor the meeting-booking stage in between, this dashboard closes a meaningful visibility gap.